Watch your Automations
Overview
Section titled “Overview”The Automations tab is the read-only operations view of the Agent Control Plane. It combines two metric cards, an interactive sankey, and two sub-tables — Automations and Consumption — that you can search, filter, and sort.
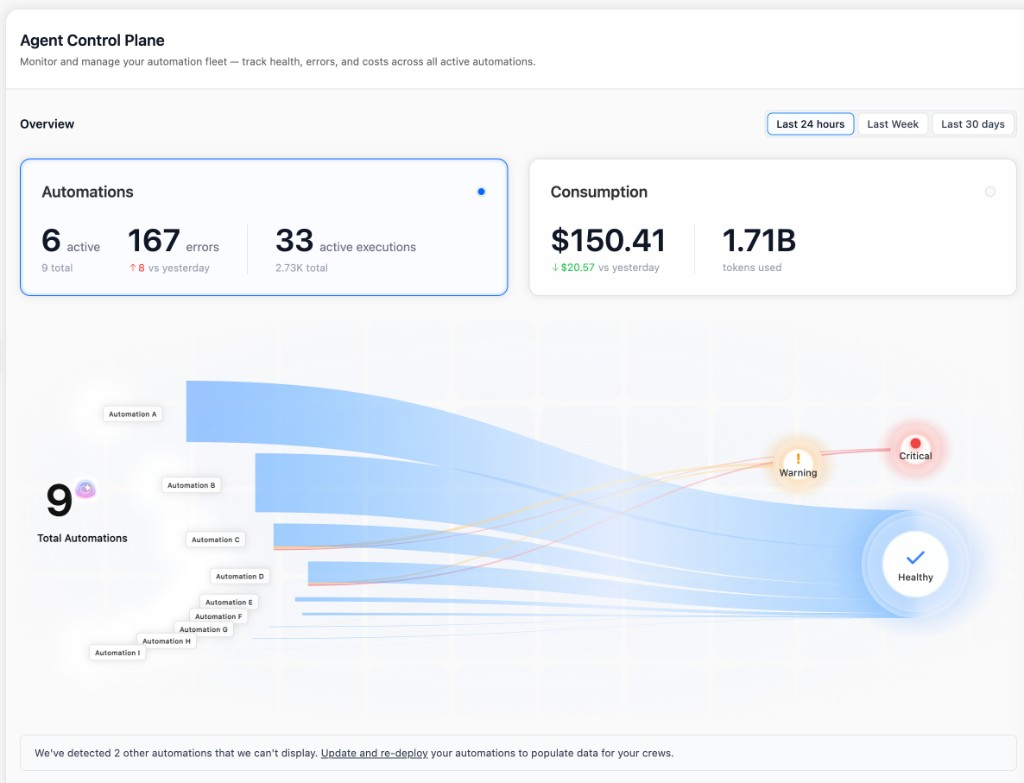
All charts and tables respect the Last 24 hours / Last Week / Last 30 days selector at the top right. Deltas compare the selected window against the previous one of the same length.
Dashboard
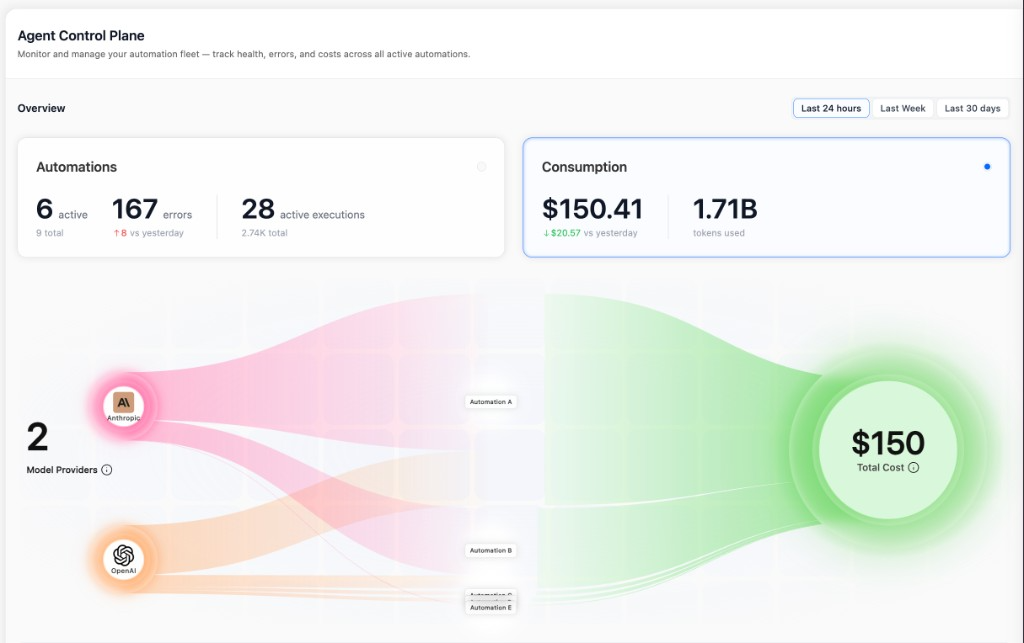
Section titled “Dashboard”The header of the page has two metric cards and an interactive sankey. Clicking either card switches the sankey between two modes:
- Health mode —
Total Automations → status buckets (Critical / Warning / Healthy). Click a bucket to filter the Automations table to just those deployments. - Consumption mode —
Model Providers → Automations → Total Cost. Click a provider to filter the Consumption table to that provider.
| Card | What it shows |
|---|---|
| Automations | active automations (and total count), total errors in the window, currently active executions (and total in the window), with a delta vs the previous period. |
| Consumption | Total cost and tokens used, with a cost delta vs the previous period. |
Automations table
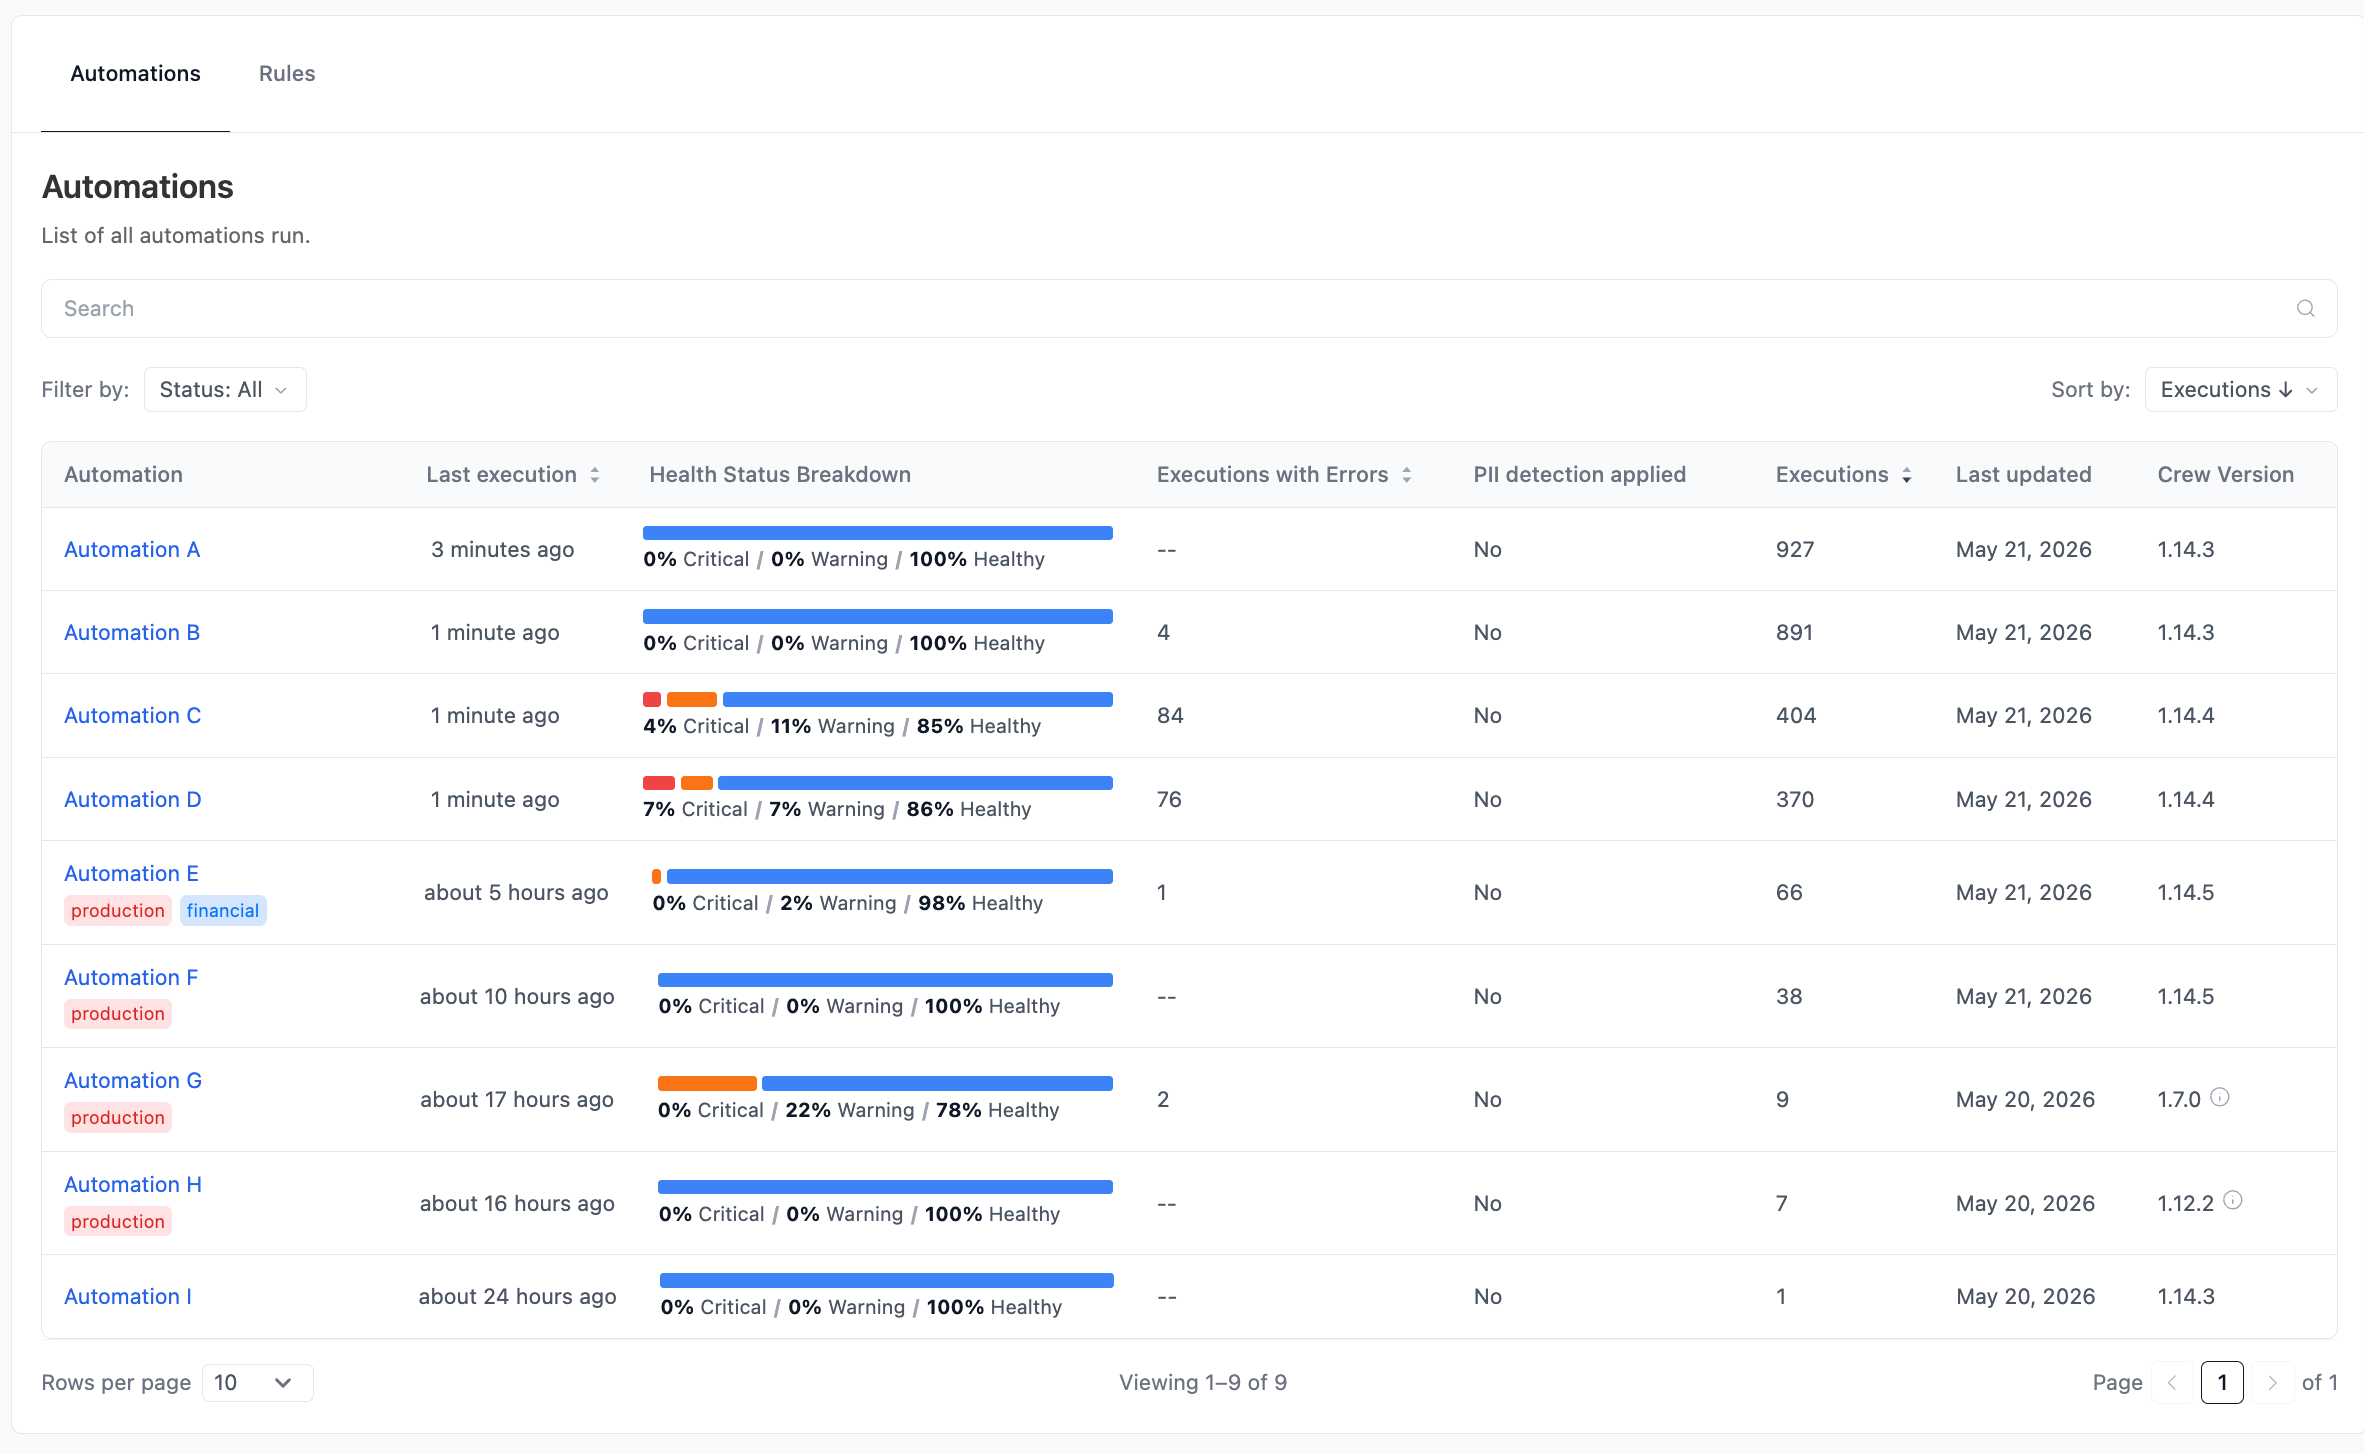
Section titled “Automations table”The Automations sub-tab is the per-deployment breakdown of fleet health. Each row is one deployed crew or flow.
| Column | What it shows |
|---|---|
| Automation | Deployment name and any tags assigned to it (e.g. production, financial). |
| Last execution | Time since the most recent run. |
| Health Status Breakdown | Stacked bar of Critical / Warning / Healthy percentages for executions in the window. |
| Executions with Errors | Total failed executions in the window. |
| PII detection applied | Yes if a per-deployment PII config or a matching PII rule is active. |
| Executions | Total executions in the window. |
| Last updated | When the deployment was last re-deployed. |
| Crew Version | The crewai version reported by the deployment. An info icon next to versions below 1.13 flags rows that can’t contribute metrics. |
Search by name, filter by Status (Healthy / Warning / Critical), and sort by any column header. Click a deployment name to open the Automation panel (see below).
Consumption table
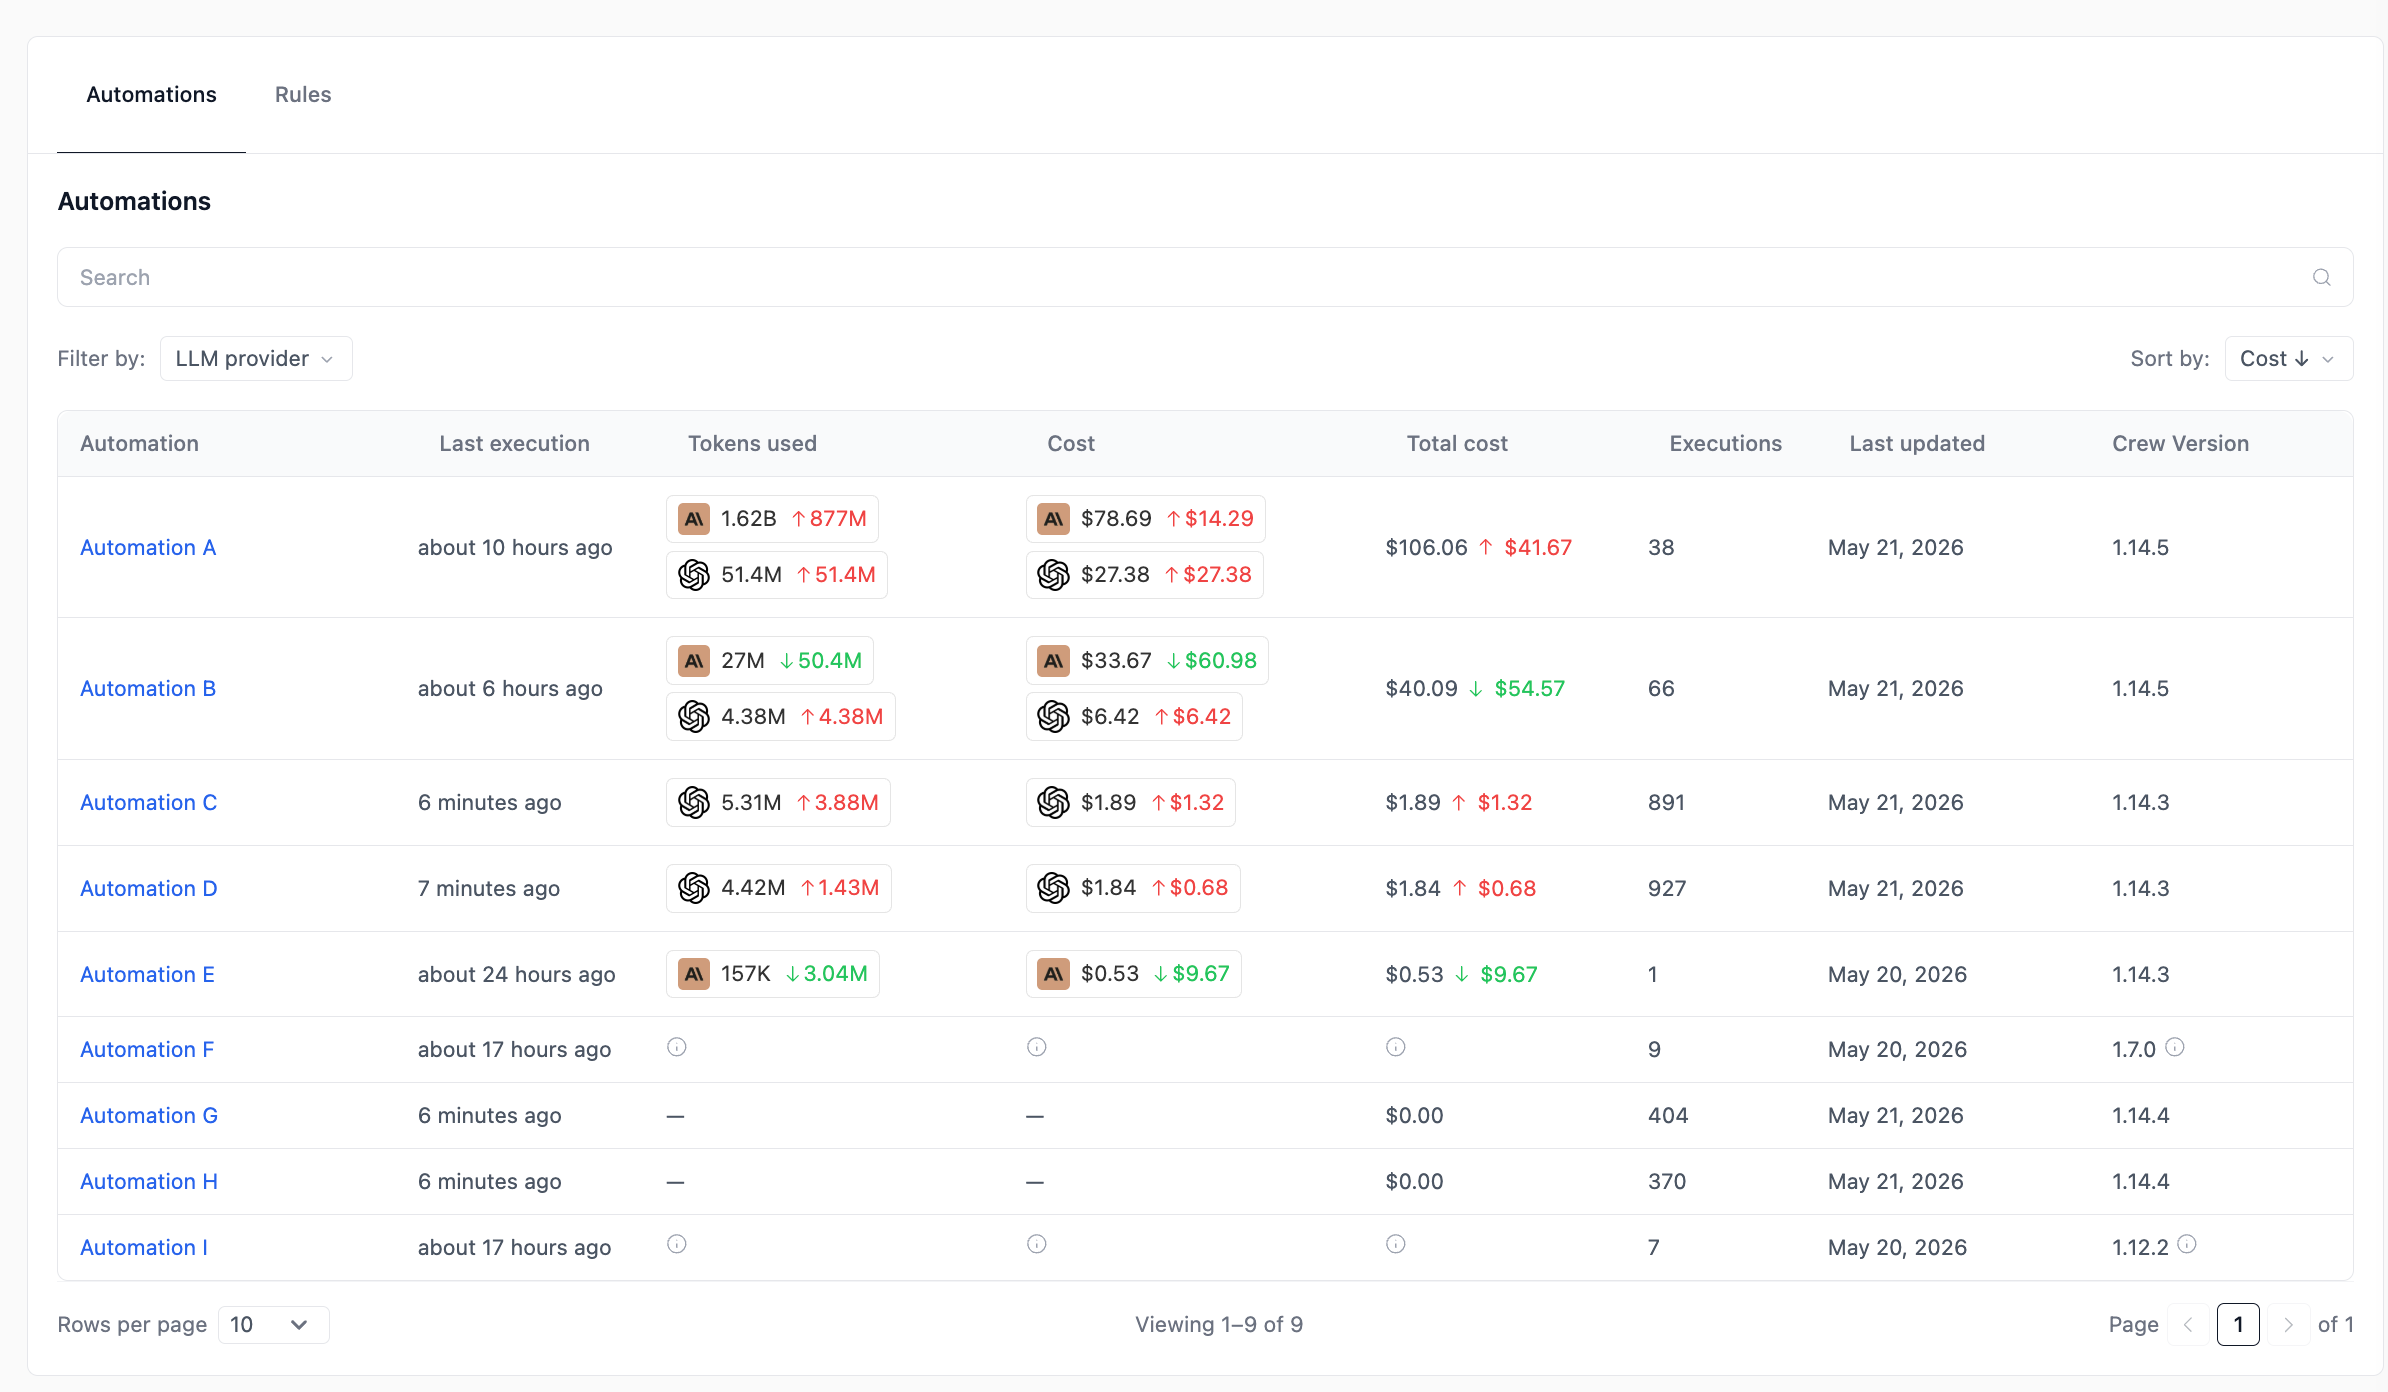
Section titled “Consumption table”The Consumption sub-tab is the per-deployment breakdown of LLM spend and token usage.
| Column | What it shows |
|---|---|
| Automation | Deployment name. |
| Last execution | Time since the most recent run. |
| Tokens used | One row per LLM provider used by this automation, with the delta vs the previous period. |
| Cost | Cost per LLM provider, with the delta vs the previous period. |
| Total cost | Sum across all providers, with the delta. |
| Executions | Total executions in the window. |
| Last updated | When the deployment was last re-deployed. |
| Crew Version | The crewai version reported by the deployment. |
Filter by LLM provider and sort by Cost, Executions, or Last run.
Related
Section titled “Related”Agent Control Plane — Overview
What ACP is, requirements, plan tiers, and RBAC.
Agent Control Plane — Rules
Apply organization-wide PII Redaction rules across many automations.
Traces
Drill into a single execution to see agent reasoning, tool calls, and token usage.
Deploy to AMP
Deploy a crew on a crewAI version that supports the Agent Control Plane.
Need Help?
Contact our support team for help interpreting metrics in the Agent Control Plane.